6.1 Area Between Two Curves
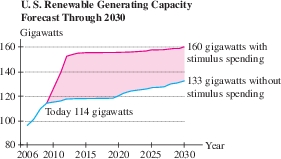
Sometimes we are interested in the area between two curves. Figure 6.1 shows projected electric power generation in the U.S. through renewable resources (wind, solar, biofuels, etc.) under two scenarios: with and without government stimulus spending. The area of the shaded region between the two graphs represents the additional energy projected to result from stimulus spending.
Now suppose that we are given two functions \(y = f(x)\) and \(y = g(x)\) such that \(f(x) \geq g(x)\) for all \(x\) in an interval \([a, b]\). Then the graph of \(f(x)\) lies above the graph of \(g(x)\) [Figure 6.2], and the area between the graphs is equal to the integral of \(f(x) - g(x)\): \[ \begin{eqnarray} \text{Area between the graphs} & =&\int_a^b f(x)\, dx - \int_a^b g(x)\, dx\nonumber\\ & =& \int_a^b \big(f(x) - g(x)\big)\, dx \end{eqnarray} \]
Figure 6.2 illustrates this formula in the case that both graphs lie above the \(x\)-axis. We see that the region between the graphs is obtained by removing the region under \(y = g(x)\) from the region under \(y = f(x)\).

358
EXAMPLE 1
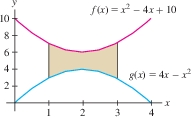
Find the area of the region between the graphs of the functions \[ f(x)= x^2-4x+10,\qquad g(x)=4x-x^2,\quad\qquad 1\le x \le 3 \]
Solution First, we must determine which graph lies on top. Figure 6.3 shows that \(f(x)\ge g(x)\), as we can verify directly by completing the square: \[ f(x)-g(x) = (x^2-4x+10)-(4x-x^2) = 2x^2-8x+10 = 2(x-2)^2 +2 \gt 0 \] Therefore, by Eq. (1), the area between the graphs is \[ \begin{eqnarray*} &&\int_1^3 \Big(f(x)-g(x)\Big) \, dx=\int_1^3 \big((x^2-4x+10)-(4x-x^2)\big) \, dx\\ &&\qquad = \int_1^3(2x^2-8x+10)\, dx = \left.\left(\frac23x^3 - 4x^2+10x \right)\right|_1^3 = 12-\frac{20}3=\frac{16}3 \end{eqnarray*} \]
Before continuing with more examples, we note that Eq. (1) remains valid whenever \(f(x) \geq g(x)\), even if \(f(x)\) and \(g(x)\) are not assumed to be positive. Recall that the integral is a limit of Riemann sums: \[ \int_a^b \big(f(x) - g(x)\big)\, dx = \lim_{\left\|{P}\right\|\to 0} R(f-g,P,C) = \lim_{N\to\infty} \sum_{i=1}^N \bigl(f(c_i) - g(c_i)\bigr)\Delta x_i \] where \(C = \{c_1, \ldots, c_N\}\) is a set of sample points for a partition \(P\) of \([a,b]\) and \(\Delta x_i = x_i - x_{i-1}\). The \(i\)th term in the sum is the area of a thin vertical rectangle (Figure 6.4): \[ \big(f(c_i) - g(c_i)\big)\Delta x_i= \textrm{height} \times \textrm{width} \]
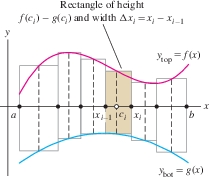
Therefore, \(R(f-g,P,C)\) is an approximation to the area between the graphs using thin vertical rectangles. As the norm \(\left\|{P}\right\|\) tends to zero, the rectangles get thinner and the Riemann sum converges to the area between the graphs. Writing \(y_{\mathrm{top}}=f(x)\) for the upper graph and \(y_{\mathrm{bot}}=g(x)\) for the lower graph, we obtain \[ \begin{equation} \boxed{\bbox[#FAF8ED,5pt]{ \textrm{Area between the graphs} = \int_a^b (y_{\mathrm{top}}-y_{\mathrm{bot}})\,dx = \int_a^b \big(f(x)-g(x)\big)\,dx }} \end{equation} \]
Keep in mind that \((y_{\mathrm{top}}-y_{\mathrm{bot}})\) is the height of a vertical slice of the region.
EXAMPLE 2
Find the area between the graphs of \(f(x) = x^2 - 5x -7\) and \(g(x) = x - 12\) over \([-2,5]\).
Solution First, we must determine which graph lies on top.
Step 1. Sketch the region (especially, find any points of intersection).
We know that \(y=f(x)\) is a parabola with \(y\)-intercept \(-7\) and that \(y=g(x)\) is a line with \(y\)-intercept \(-12\) (Figure 6.5). To determine where the graphs intersect, we observe \[ f(x) - g(x) = (x^2-5x-7) - (x-12) = x^2-6x+5 = (x-1)(x-5) \]
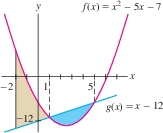
The graphs intersect where \((x-1)(x-5)=0\), that is, at \(x=1\) and \(x=5\).
Step 2. Set up the integrals and evaluate.
We also see that \(f(x)-g(x) \leq 0\) for \(1 \leq x \lt 5\), and thus \[ f(x)\ge g(x) \textrm{on} [-2,1]\qquad\hbox{and}\qquad g(x)\ge f(x) \textrm{on} [1,5] \]
359
In Example 2, we found the intersection points of \(y= f(x)\) and \(y=g(x)\) algebraically. For more complicated functions, it may be necessary to use a computer algebra system.
Therefore, we write the area as a sum of integrals over the two intervals: \[ \begin{eqnarray*} \int_{-2}^5 &&(y_{\mathrm{top}} - y_{\mathrm{bot}})\,dx = \int_{-2}^1 \big(f(x)-g(x)\big)\, dx + \int_1^5 \big(g(x)-f(x)\big)\, dx\\ &&\qquad= \int_{-2}^1 \big((x^2-5x-7) - (x-12)\big)\, dx + \int_1^5 \big((x-12)-(x^2-5x-7)\big)\, dx\\ &&\qquad=\int_{-2}^1 (x^2-6x+5)\,dx +\int_1^5 (-x^2+6x-5)\, dx\\ &&\qquad= \left.\left(\frac13x^3-3x^2+5x\right)\right|_{-2}^1 + \left.\left(-\frac13x^3+3x^2-5x\right)\right|_1^5\\ &&\qquad= \left(\frac73-\frac{(-74)}3\right) + \left(\frac{25}3-\frac{(-7)}3\right) = \frac{113}{3} \end{eqnarray*} \]
EXAMPLE 3 Calculating Area by Dividing the Region
Find the area of the region bounded by the graphs of \(y={8}/{x^2}\), \(y = 8x\), and \(y = x\).
Solution
Step 1. Sketch the region (especially, find any points of intersection).
The curve \(y={8}/{x^2}\) cuts off a region in the sector between the two lines \(y=8x\) and \(y=x\) (Figure 6.6). We find the intersection of \(y={8}/{x^2}\) and \(y=8x\) by solving \[ \frac{8}{x^2}=8x\quad\Rightarrow\quad x^3=1\quad\Rightarrow\quad x=1 \] and the intersection of \(y={8}/{x^2}\) and \(y=x\) by solving \[ \frac{8}{x^2}=x\quad\Rightarrow\quad x^3=8\quad\Rightarrow\quad x=2 \]
Step 2. Set up the integrals and evaluate.
Figure 6.6 shows that \(y_{\mathrm{bot}}=x\), but \(y_{\mathrm{top}}\) changes at \(x=1\) from \(y_{\mathrm{top}}=8x\) to \(y_{\mathrm{top}}={8}/{x^2}\). Therefore, we break up the regions into two parts, \(A\) and \(B\), and compute their areas separately. \[ \begin{align*} \textrm{Area of \(A\)} &= \int_0^1\left(y_{\mathrm{top}}-y_{\mathrm{bot}}\right) dx = \int_0^1\left(8x - x\right)\,dx =\int_0^1 7x \,dx=\frac72\, x^2\bigg|_0^1 = \frac72\\ \textrm{Area of \(B\)} &= \int_1^2\left(y_{\mathrm{top}}-y_{\mathrm{bot}}\right) dx = \int_1^2\left(\frac8{x^2} - x\right)\,dx=\left(-\frac{8}{x} - \frac12 x^2\right)\bigg|_1^2= \frac52 \end{align*} \] The total area bounded by the curves is the sum \(\frac72+\frac52=6\).

360
Integration Along the \(y\)-Axis
Suppose we are given \(x\) as a function of \(y\), say, \(x=g(y)\). What is the meaning of the integral \(\int_c^d g(y)\,dy\)? This integral can be interpreted as signed area, where regions to the right of the \(y\)-axis have positive area and regions to the left have negative area: \[ \int_c^d g(y)\,dy = \textrm{signed area between graph and \(y\)-axis for \(c \leq y \leq d\)} \] In Figure 6.7(A), the part of the shaded region to the left of the \(y\)-axis has negative signed area. The signed area of the entire region is \[ \underset{\underset{{{\hbox{area to the left of y-axis}}}}{\hbox{Area to the right of y-axis minus}}}{\underbrace{\int_{-6}^6 (y^2-9)\, dy}} = \left(\frac13y^3-9y\right)\bigg|_{-6}^6 = 36 \]
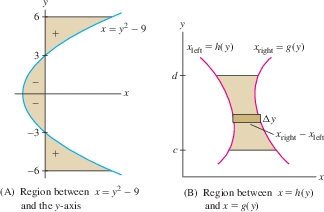
More generally, if \(g(y)\ge h(y)\) as in Figure 6.7(B), then the graph of \(x=g(y)\) lies to the right of the graph of \(x=h(y)\). In this case, we write \(x_{\mathrm{right}} = g(y)\) and \(x_{\mathrm{left}} = h(y)\). The formula for area corresponding to Eq. (2) is \[ \begin{equation} \boxed{{\textrm{Area between the graphs} =\int_c^d (x_{\mathrm{right}}-x_{\mathrm{left}})\, dy = \int_c^d \big(g(y)-h(y)\big)\, dy }} \end{equation}\]
EXAMPLE 4
Calculate the area enclosed by the graphs of \(h(y)=y^2-1\) and \(g(y) = y^2-\tfrac18y^4 +1\).
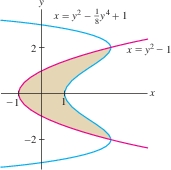
Solution First, we find the points where the graphs intersect by solving \(g(y)=h(y)\) for \(y\): \[ y^2-\frac18y^4 +1 = y^2-1\quad\Rightarrow\quad \frac18y^4-2=0\quad\Rightarrow\quad y=\pm 2 \]
Figure 6.8 shows that the enclosed region stretches from \(y=-2\) to \(y=2\). On this interval, \(g(y)\ge h(y)\). Therefore \(x_{\text{right}}=g(y)\), \(x_{\text{left}}=h(y)\), and \[ x_{\text{right}} - x_{\text{left}} = \left(y^2-\frac18y^4 +1\right) - (y^2-1) = 2-\frac18y^4 \]
361
The enclosed area is \[ \begin{align*} \int_{-2}^2(x_{\text{right}} - x_{\text{left}})\,dy &= \int_{-2}^2\left(2-\frac18y^4\right)dy = \left(2y - \frac1{40}y^5\right)\Bigg|_{-2}^2\\ & = \frac{16}5-\left(-\frac{16}5\right)=\frac{32}5 \end{align*} \]
It would be more difficult to calculate the area of the region in Figure 6.8 as an integral with respect to \(x\) because the curves are not graphs of functions of \(x\).
6.1.1 Summary
- If \(f(x)\ge g(x)\) on \([a,b]\), then the area between the graphs is \[ \textrm{Area between the graphs}= \int_a^b \big(y_{\mathrm{top}}-y_{\mathrm{bot}}\big)\,dx = \int_a^b \big(f(x)-g(x)\big)\,dx \]
- To calculate the area between \(y=f(x)\) and \(y=g(x)\), sketch the region to find \(y_{\mathrm{top}}\). If necessary, find points of intersection by solving \(f(x) = g(x)\).
- Integral along the \(y\)-axis: \(\int_c^d g(y)\,dy\) is equal to the signed area between the graph and the \(y\)-axis for \(c \leq y \leq d\). Area to the right of the \(y\)-axis is positive and area to the left is negative.
- If \(g(y) \ge h(y)\) on \([c,d]\), then \(x=g(y)\) lies to the right of \(x=h(y)\) and \[ \textrm{Area between the graphs} = \int_c^d \big(x_{\mathrm{right}}-x_{\mathrm{left}}\big)\,dy = \int_c^d \big(g(y)-h(y)\big)\,dy \]